As you may be aware, our US Large Cap Equity strategy is underperforming the S&P 500 TR by 5% in the first four months of 2019. Even if we wrote monthly portfolio manager commentaries explaining the performance attribution, we thought it would be a good idea to provide an additional explanation for our subscribers.
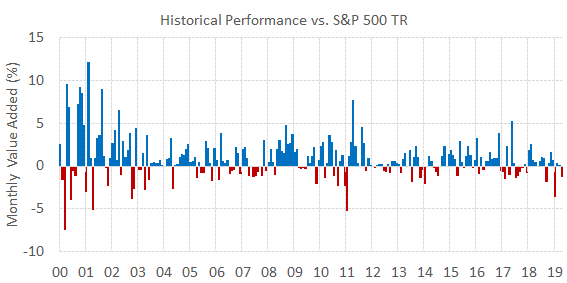
First, let’s see how the monthly value added of 2019 compares to the historical alpha generated by the strategy. As you can see on the chart below, what we have experienced so far is not unusual as there are other periods such as in 2000-2003 and 2010-2011 where the strategy had streaks of negative alpha. Therefore, for now there is not much to worry about although we have to keep monitoring the situation in the next months.
Market Conditions
Then we must ask ourselves: how did we get there? Let’s take a look at the market environment in which we underperformed. The S&P 500 TR fell -9% in December, its worst December since 1931 on signs of a global economic slowdown, concerns about monetary policy and political dysfunction. Since then, most of these worries dissipated thanks to dovish central banks and the promise of a US-China trade deal. Markets made a huge V shape rally on low volatility and the S&P 500 TR is now sitting on a hefty 18.2% YTD return.
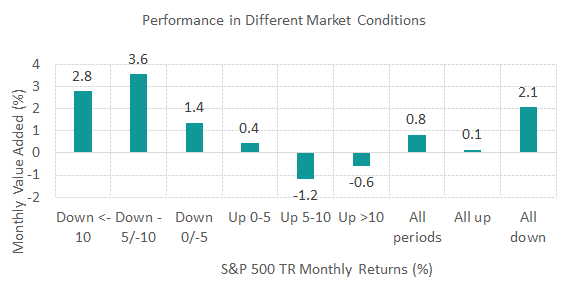
As we illustrated in our performance in different market conditions chart below, our strategy tilted to quality + value factors may underperform when the market is very bullish. Investors chase higher returns by taking more risks. Therefore, glamour stocks exhibiting growth tend to outperform relative to value. As long as the financial markets are going to keep going up fast and quickly, we may struggle to outperform on a relative basis. However, this explanation is only one part of the story as it doesn’t explain most of our underperformance.
Sector Allocation
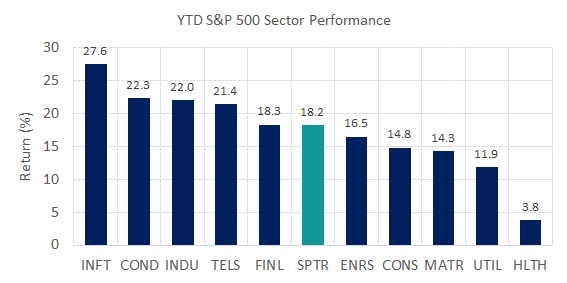
Another aspect we have to pay attention is the sector allocation. As of April 30th, the strategy is overweighed staples and health care, two sectors that are known to be defensive. When market conditions are favorable as we have seen this year, investors tend to prefer cyclicals over defensives. The numbers speak for themselves as the leaders in this rally were Info tech, Discretionary and Industrials as shown on the chart below. Because our sector allocation is dictated by our stock picks, we have to take a look at the last rebalancing of December 1st, 2018.
Stock Picking
Based on our investment process, the strategy selected a few stocks related to the US health care system because they appeared as high quality stocks trading at reasonable prices. We are referring to Wal Greens (WBA), Bristol-Myers (BMY), Merck (MRK) and UnitedHealth (UNH). Unfortunately for us, they turned out to be value traps. Why? The ranking system couldn’t see U.S. regulators would want to tackle high drug prices in 2019. Consequently, health insurers, pharmacies and drug manufacturers stocks are lagging since this political announcement.
Conclusion
On the next rebalancing of June 3rd 2019, some of these aforementioned stocks may get out because their final ranks are curently below 70%, thanks to the 20% momentum category of our ranking system. We will be more cautious and assess the “sector risk” and even the “industry risk” of our stocks the same way we evaluate the “country risk” of our stocks in the international strategy. Hopefully this will pave the way back to outperformance on the second half of 2019. We will keep monitoring the performance of the strategy vs. the benchmark.
The Portfolio Management Team