A client forwarded us the following article as we were discussing high dividend strategies: This stable dividend portfolio has market beating returns with little drama. It is written as a special report and seemingly produces outstanding results despite its simplicity. Simple is a good thing but is it too good to be true? Let’s find out.
Here are the key takeaways of the article:
- 13.7% annualized return over the last 25 years;
- Beat the S&P/TSX TR by 6.3% for the same period;
- Maximum drawdown of only -26% vs -36% index.
The author is using a Bloomberg Terminal to backtest his model portfolio strategy from 1994 to Today. We don’t have access to point-in-time historical data prior 1999 with S&P Global because some data sets are unavailable before. For the sake of comparison, the annualized return of his strategy is 12.7% starting from 1999 to Today.
Below are the instructions to replicate the strategy:
- Custom Universe with 300 largest stocks in Canada;
- Pick 20 stocks rebalanced on a yearly/monthly basis;
- Stocks must pay a dividend (Dividend Yield>0);
- 1-factor ranking system: low volatility 252 days.
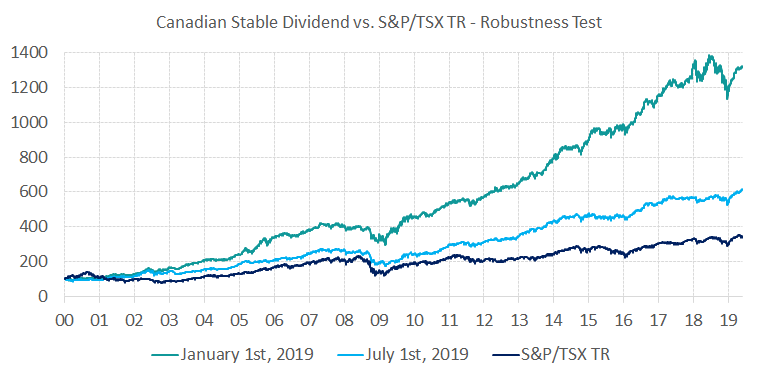
Robustness Test
The best way to test the robustness of a strategy is to give a different starting point, especially with annual rebalancing. As you can see below, if we start as of January 1st, 1999, it is consistent with the author’s results. However changing the starting point six months later drastically change the outcome of the strategy.
| Starting Point | Annualized Return | Annual Turnover | Maximum DD | Sharpe Ratio |
| Jan 1st, 1999 | 13.0% | 75.6% | -29.8% | 1.08 |
| Jul 1st, 1999 | 9.1% | 60.3% | -37.1% | 0.70 |
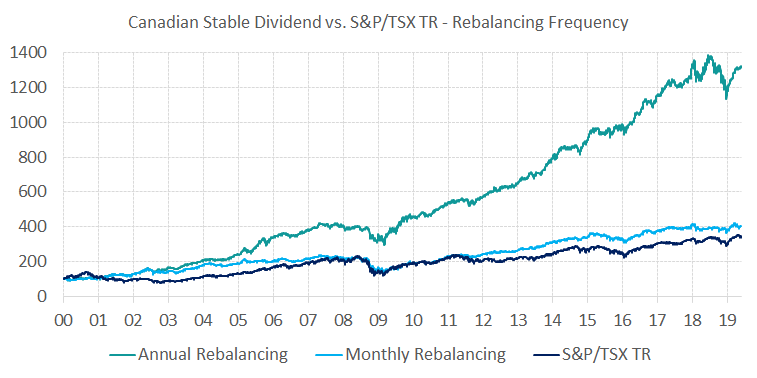
Rebalancing Frequency
The author claimed he was able to successfully change the rebalance frequency from annual to monthly and produce slightly improved results. However, he failed to consider the significant trading costs tied to the high portfolio turnover that exploded to 263.1% from pruning his stocks every month. This omission is so important that it makes his strategy not that great anymore as you can see in the strategy statistics below.
| Rebalancing | Annualized Return | Annual Turnover | Maximum DD | Sharpe Ratio |
| Annual | 13.0% | 75.6% | -29.8% | 1.08 |
| Monthly | 6.3% | 263.1% | -43.4% | 0.45 |
Conclusion
The strategy in the article is not robust because changing the starting point produces significantly different results. Moreover, the strategy fails to take into account the trading costs generated by the high turnover with monthly rebalancing. These trading costs being the actual + slippage costs, which can be high for some of the thinly traded securities. The strategy does show the merit of combining a low volatility factor with Canadian dividend stocks. However, the proposed investment solution by the author is not polished enough to be used in real life.
The Portfolio Management Team