This month, we made improvements to our rankings following the feedback received from our prospects and clients. To recap the benefits, we will explain how we created them, their interpretation and answer any questions you may have.
Empirical Evidence
In the last six years, we have researched more than 1800 factors over two full business cycles. As we looked at the behavior of each of those factors within different investment universes, we discovered that a performing strategy can be built from a combination of factors inside a ranking system. By rigorously investing over time in the best ranked stocks of an investment universe, we generate higher risk adjusted returns and outperform the benchmark.
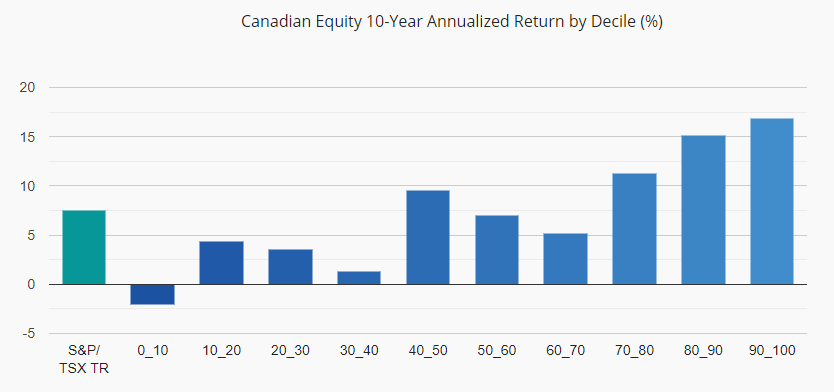
As shown below, investing in stocks belonging to the top three deciles vastly outperform stocks in any other deciles. Because our Canadian universe is made of 250 stocks, three deciles means that only 75 stocks are considered. Since this is too many stocks to own, we apply various rules to build a strategy with only 25 stocks. By following the strategy, we would have generated a 10-year annualized return of 16.1% vs 7.4% for the S&P/TSX TR as of July 31th, 2019.

General Guideline
To simplify our multi-factor approach, we decided to slice the investment universe in deciles. Based on our Canadian Equity rankings performance by decile chart shown above, we propose to classify and look at stocks as follow:
- Strong Buy: Stocks ranked in the first decile (90-100);
- Buy: Stocks ranked from the second decile (80-90);
- Hold: Stocks ranked in the third decile (70-80);
- Sell: Stocks ranked in the fourth decile and below (<70).
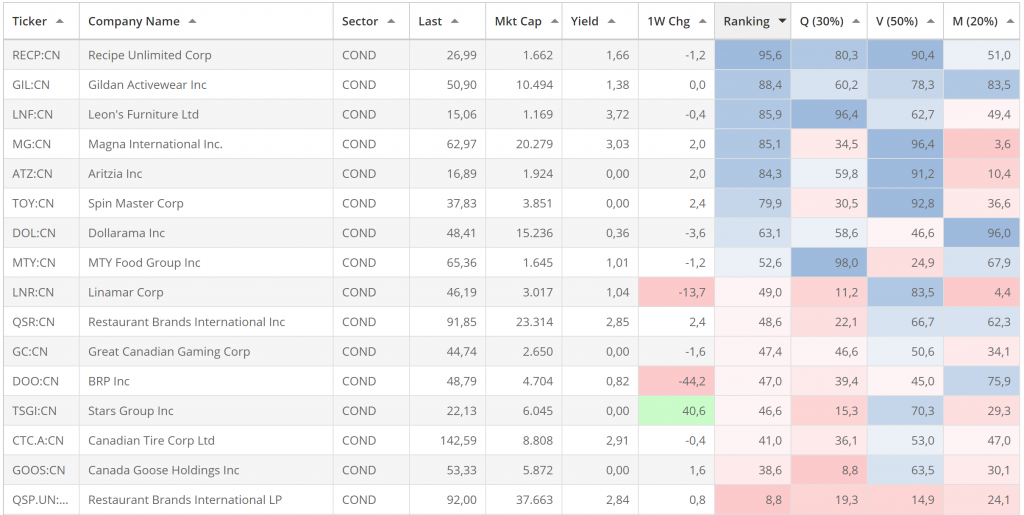
We never hold in our strategies a stock ranked below 70 after a quarterly rebalancing. This could be an easy way to quickly integrate a discipline in your investment process. By following the rank changes overtime, you will notice the rank of stocks such as Royal Bank (RY:CN) are stable, while others like Canadian Tire (CTC.A:CN) have deteriorated. The rankings and rules in our investment process, generate an average of three sells / three buys per quarter.
Understanding the Factors
Specifically for the Canadian universe, we found that only 15 factors out of the 1800 consistently generate value-added over the S&P/TSX TR. This conclusion came after backtesting each factor individually and then, combining them together with the objective of maximizing the risk adjusted returns while maintaining a low portfolio turnover.
Most of our factors comes from three different styles: Quality, Value and Momentum. The full definition of each factor is available in our Canadian Equity Strategy Presentation. The rankings are shared on a weekly and monthly basis with our subscribers. To see which factors we are using, please register and download our latest presentation.
Here is an example of our top Canadian ranking as of August 4th, 2019:

Implementation is Key
If you share our investment philosophy and investment process, our rankings should give you insights on the attractiveness of companies relative to each other. For example, if you monitor the weekly changes, you could decide to overweight the Strong Buys. You could also sort by sector and quickly find a replacement for a stock.
Also, you could decide to overlay our rankings with your own methodology . For example, you could use them as a quantitative screener before picking the stocks yourself. However, if you need more guidance or need marketing material, subscribing to our strategies is your best bet as we provide you with all the information you need.
Free 1-Month Trial
No matter the way you plan on using our material, we make the effort to make our rankings easily available to you. Because our factors are calculated from financial statements and are based on universes of large cap stocks, we cover 250 stocks within the S&P/TSX, 500 stocks within the S&P 500 and roughly 425 ADRs. As shown below, you will find performing stocks in just a few minutes, a fraction of the time you probably spend on that matter.

The best way to get comfortable is to get your Free 1-Month Trial today. See for yourself how our rankings can be a great addition for your practice. Don’t hesitate to send us your comments and questions at rfortier@factorbased.com.
The Portfolio Management Team