Selling Our Largest Position
Constellation Software (CSU:CN) was by far the largest position of our Canadian Equity Strategy. As of September 30th, the company had a weight of 9.4% and was held for 486 days. On rebalancing day, we sold our position because its rank fell below 70. Considering the importance of this position for our clients, we decided to write this report.
Growth Through Acquisitions
For those less familiar, Constellation Software develops and sells software solutions to a number of industries, both in the public and private sectors. They have six operating groups and customers in over 100 different markets worldwide. The company’s strategy is well known: to acquire, manage and build software solutions. Over the last 25 years, Constellation acquired more than 260 tech start-ups, which is approximately 10 acquisitions each year.
In an environment with high output growth and low interest rates, the company’s strategy paid off handsomely. Just over the last year, shares surged as much as 52% while the software industry was still up a significant 24%. Is this price appreciation expected to continue? Time will tell. However, our ranking system is telling us to be more cautious.
Ranking System Overview
In the table below, we see that Constellation’s rank fell from 81.0 to 52.9 just in the last two months. All style factors contributed to the decline. However, Quality and Value styles were the main contributors for two reasons: 1) factors within those styles fell significantly and 2) Quality and Value styles represent 80% of the weight of the ranking system. In the next paragraphs, we will highlight and discuss those factors responsible for triggering the sell rule.
| Style Factors | 2019/07/31 | 2019/09/30 | Difference | Weight | D * W |
| Quality | 71.4 | 35.0 | -36.4 | 30% | -10.9 |
| Value | 64.3 | 48.4 | -15.9 | 50% | -8.0 |
| Momentum | 85.7 | 80.5 | -5.2 | 20% | -1.0 |
| Rank | 81.0 | 52.9 | -28.1 | 100% | -28.0 |
Quality Factors
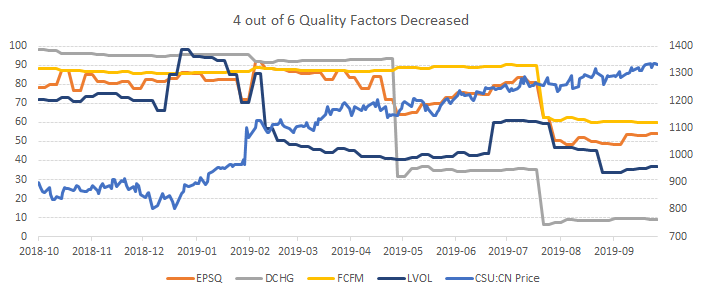
As the stock price increased last year, so did the volatility. This corresponds to the decrease of the low volatility (LVOL) factor. The company’s beta is at 1.00, which is the same as the stock market. However, it is high considering it used to be around 0.45 over the last decade.
The long-term debt to capital ratio increased, which made the debt reduction (DCHG) factor drop from 99 to 40 after Q1 2019 and from 40 to 10 after Q2 2019. This means some of its latest M&A activity is starting to materialize in the financial statements.
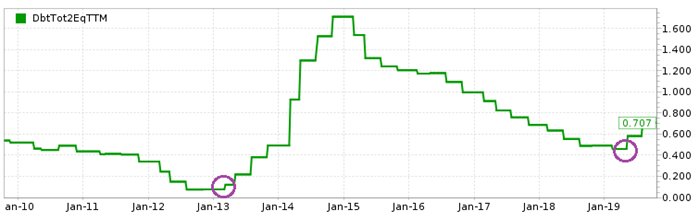
As of now, the total debt to equity ratio of 0.71 is high, compared the industry’s average of 0.26. However, CSU’s total debt to equity ratio deleveraged from 1.70 to 0.45 over the past 5 years. The company seems to be re-leveraging again, but at the end of a business cycle. On the plus side, the company’s debt is still well covered by operating cash flows.
As factors are often linked together, especially within their factor styles, free cash flow margins (FCFM) factor and earnings quality (EPSQ) factor also deteriorated in Q2 2019. Newly acquired companies have yet to show synergies and this is dragging down CSU’s profitability.
Value Factors
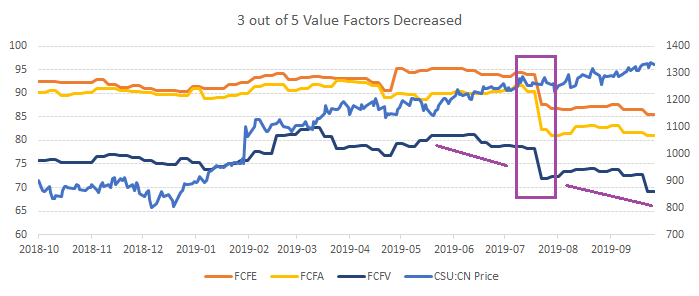
CSU’s Free Cash Flow TTM (Trailing Twelve Months) went from C$796 million to C$226 million after the release of Q2 2019. Upon further investigation, the C$570 million drop is explained by a one-time special dividend. This usually means the management was unable make good use of its cash balance and thought it would be the best to give back to shareholders.
This explains why the Discounted Free Cash Flow / Assets (FCFA), Discounted Free Cash Flow / Equity (FCFE), and Discounted Free Cash Flow / EV (FCFV) factors fell around August 2nd, 2019. If we reverse the special dividend, those ratios would still be trending down, albeit less.
Momentum Factors
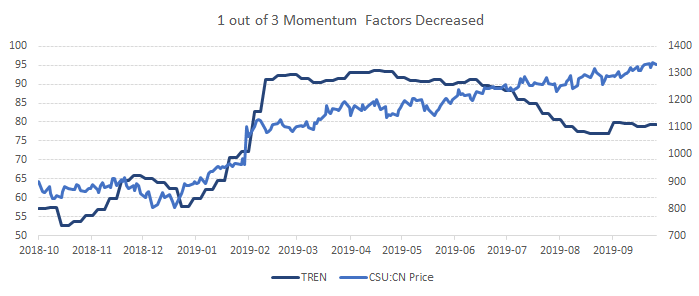
The Trend (TREN) factor, which is calculated as the 20-day EMA divided by the 200-day EMA, started decreasing around April 2019. This means that although the company’s shares were in an uptrend, the short-term trend weakened while the long-term trend stayed steady. This explains why the Momentum style decreased over the last two months.
Conclusion
By doing this exercise, we notice the weakness of the ranking system to process unique events such as the special dividend. However, even if we reverse the special dividend, the ranking would probably be between 65 and 70 instead of 52.9 so we till would have sold it.
In its last conference call, the management said it was optimistic about M&A prospects. However, the special dividend and the announcement of a lower hurdle rate is showing that not only they are struggling to find M&As, they are also willing to be less picky.
This uncertainty, in sustaining both the quantity and quality of M&A activity, is starting to reflect in CSU’s stock volatility. Although the company is still in good financial health, we believe shares are fairly valued. Our ranking says there are better opportunities elsewhere.