Summary
- This current yield curve steepening is different from all the other ones seen over the last fifty years and should be treated as such.
- A yield curve steepening in a low inflationary environment where short rates are falling faster than long rates is historically bearish.
- A yield curve steepening in a high inflationary environment where short rates are falling faster than long rates is historically bullish.
- A yield curve steepening where short rates are flat and long rates are rising is not bearish for equities. This is what we have right now.
Different Steepenings
The yield curve has gained much attention from investors over the last few weeks because the 10-year treasury yield rose from 0.92% in January to 1.63% recently, pushing the yield curve back to its mean. Historically, the yield curve follows the business cycle, going from one extreme to another.
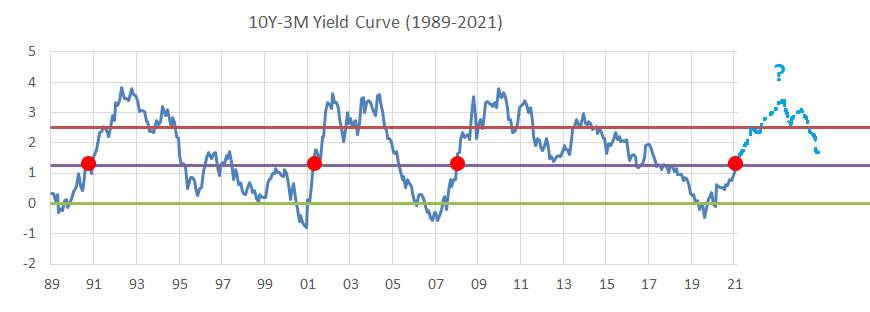
Where do we go from there? The yield curve doesn’t stay at the mean; it usually reaches the other extreme, of at least 2.5% in this case (red line). The dotted light blue line shows the likely path of the yield curve for the next two years. From a mathematical point of view, there are four ways this outcome is achieved. Let’s examine the possibilities and discuss them briefly:
Steepening #1: ↓↓ Short Rate & ↓ Long Rate
This is the most common scenario, as seen in most of the past occurrences. The Fed accommodative actions are causing the short rates to fall faster than the long rates, causing the yield curve to become “normal” again.
Steepening #2: ↓ Short Rate & → Long Rate
This scenario is unlikely. At least we haven’t seen an example by looking at the past. The reason is that the long rate is less sticky than the short rate because of its higher duration and fluctuations in the secondary market.
Steepening #3: → Short Rate & ↑ Long Rate
This is what we have seen from the yield curve’s trough in August 2020 to where we are now. There is no reason to believe this will change, at least for the next couple months, because the Fed’s stance remains dovish.
Steepening #4: ↑ Short Rate & ↑↑ Long Rate
This may be possible if the growth/inflation targets are met and the Fed is very gentle in its initial rate hikes. Like Steepening #2, we haven’t seen any case coming off an inverted yield curve, so this is also unlikely.
Low Rate Environment (1989-2021)
The best way to understand the dynamics is to plot all the relevant macroeconomic time series: the S&P 500 (SPY) as a proxy for equities, the business cycle defined as the Leading Economic Indicator by the Conference Board (to understand why we use this, please read: This Sector Rotation Strategy Made 17% Each Year Since 1991), the 10Y-3M yield curve, and its two treasury yields components. Let’s also draw red vertical lines and observe:
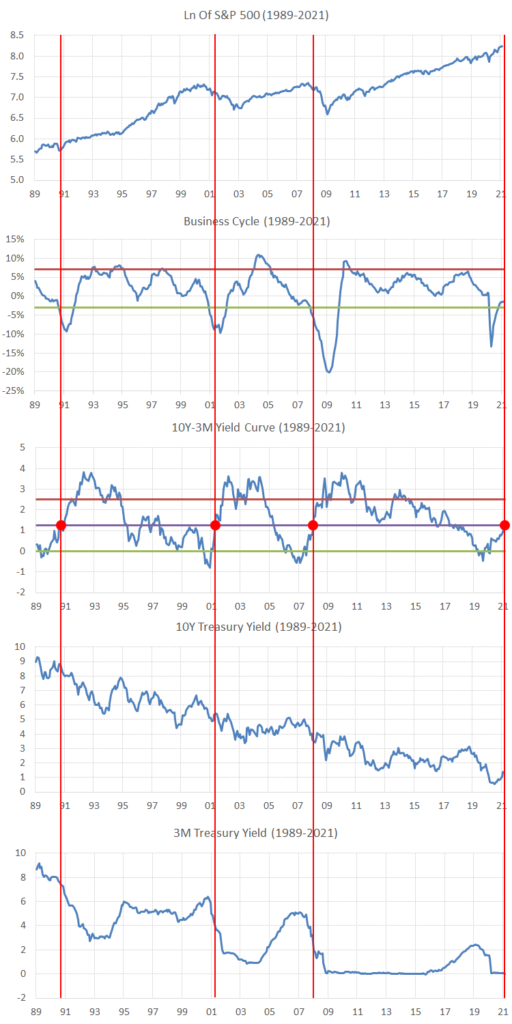
2008
Sub-prime loans with predatory features created a real estate bubble that burst in 2008. The crisis roiled world financial markets, which was exacerbated by a liquidity crunch. When the yield curve steepened past the median, the business cycle was rapidly falling. At that time, Ben Bernanke was quickly lowering the short rate to revive the crippled economy. A vast bear market ensued, and equities plummeted in the following months.
2001
The tech bubble allowed many internet stocks to become overvalued. Alan Greenspan increased the short rates from 4.75% to 6.50% from 1999 to 2000 to fix the “irrational exuberance.” He quickly changed his mind in 2001 by lowering from 6.50% to 1.75% due to the business cycle and stocks getting hammered. It takes at least 6-9 months for the dovish policy’s effects to be reflected into the economy, which is why stocks kept falling.
1990
Years of uncontrolled monetary policy caused an asset price bubble and overheating of the economy in Japan. This prompted the Bank of Japan to hike rates, pressuring US rates to rise. When the yield curve steepened past the median, the economy was already in a recession. Confidence indicators were lower following the 90’s oil shock. Alan Greenspan made the Fed Fund Rate fall from 9.75% to 3.00%. The resulting bear market was mild.
Equity Returns
I averaged the returns per sector after those three instances, where the yield curve steepened past the median (all the red dots on the previous chart). The total return time series used are the GICs sector from S&P Global. Overall, the outcome of this condition is bearish for equities in the next 12 months:
| Sector Returns | 3-Month | 6-Month | 1-Year |
| Financials | 2.9% | 2.9% | -4.0% |
| Energy | 1.9% | -1.5% | -10.5% |
| Materials | 5.5% | 4.1% | -3.2% |
| Industrials | 2.0% | -0.2% | -10.5% |
| Discretionary | 3.6% | 1.2% | -0.7% |
| Telecom | 0.7% | -8.1% | -20.3% |
| Info Tech | 1.4% | -0.3% | -16.4% |
| Staples | 6.1% | 12.9% | 13.5% |
| Utilities | -0.7% | -4.3% | -8.6% |
| Health Care | 3.3% | 10.3% | 7.2% |
| Average | 2.7% | 1.7% | -5.4% |
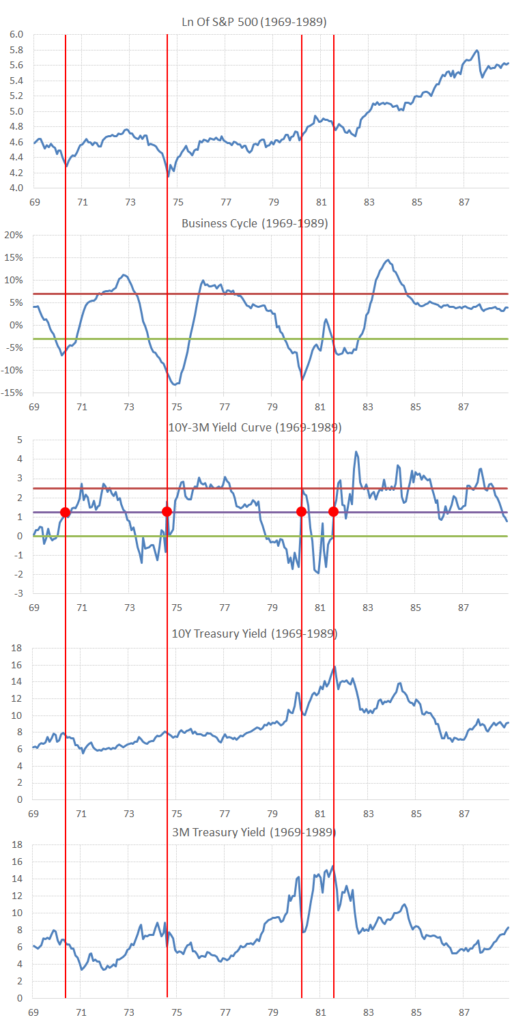
High Rate Environment (1969-1989)
Just for fun, let’s observe what happened in the high-interest rate environment when the yield curve steepened past the median. In the 70’s and 80’s, it happened four times: 1970, 1974, 1980 and 1981. In all of those instances, it marked the end of high short rate levels (as seen in the chart below).
Equity Returns
Investors welcomed that sign because it meant the rampant inflation was finally under control and the financial system’s integrity saved, for the time being. As a result, equities produced significant double-digit returns, with all sectors participating in the massive rally, as shown on the table below, which represent the average returns per sector of those four instances:
| Sector Returns | 3-Month | 6-Month | 1-Year |
| Financials | 10.6% | 21.2% | 25.1% |
| Energy | 12.2% | 22.6% | 15.7% |
| Materials | 9.9% | 19.4% | 26.0% |
| Industrials | 8.3% | 21.2% | 25.3% |
| Discretionary | 8.1% | 26.6% | 42.7% |
| Telecom | 8.1% | 11.6% | 17.5% |
| Info Tech | 9.5% | 24.9% | 25.3% |
| Staples | 11.2% | 24.4% | 35.5% |
| Utilities | 10.0% | 18.6% | 21.3% |
| Health Care | 13.3% | 23.6% | 30.8% |
| Average | 10.1% | 21.4% | 26.5% |
Note: S&P Global didn’t publish sector total return time series from 1969 to 1989. I matched the sectors created by professor Kenneth French on his website to correspond more or less as GICs sectors. GICs being the sector/industry classification system developed by S&P Global.
Final Thoughts
This is the first time we see a steepening of the yield curve where the short rate remains flat, and the long rate is rising, following an inverted yield curve. Since we can’t find another instance, we can only compare to the next closest thing. From 2009 and 2015, the short rate remained flat. In that period, we have seen one instance where the long rates surged fast.
2012
The long rate doubled from 1.48 in August 2012 to 3.03 in December 2013, while the short rate remained steady. At that time, the US economic outlook was improving, and inflation expectations were also rising. The Fed was thinking of taper its quantitative easing. This means the Fed stops buying bonds, which encourages investors to start selling bonds.
Equity Returns
During that period, financials and discretionary outperformed while tech and telecom underperformed. This is very similar to what we have seen in February and March 2021. However, it doesn’t mean that those sectors will lag, that the S&P 500 (SPY) cannot keep making new all-time highs.
| Sector Returns | 3-Month | 6-Month | 1-Year |
| Financials | 8.8% | 19.8% | 42.4% |
| Energy | 3.7% | 10.7% | 18.6% |
| Materials | 4.1% | 13.5% | 18.7% |
| Industrials | 2.6% | 13.0% | 28.7% |
| Discretionary | 6.1% | 16.3% | 38.7% |
| Telecom | -3.0% | -1.6% | 5.6% |
| Info Tech | -0.8% | 1.7% | 11.1% |
| Staples | -0.2% | 5.0% | 18.9% |
| Utilities | -1.6% | -1.2% | 8.0% |
| Health Care | 4.7% | 13.0% | 35.6% |
| Average | 2.5% | 9.0% | 22.6% |
In conclusion, long rates are only half way to their other extreme and have more room to increase this year. Unless the Fed intervenes to control the long rates, this is the most probable outcome. This is why we wrote our previous article, that Financials should still benefit from higher interest rates.
Investors are facing a positive post-pandemic economic outlook with higher growth and inflation. The overvaluation in the tech sector can play itself out by underperforming, without hindering the S&P 500 from reaching new all-time highs. For these reasons, the long rate surge is not that worrisome.