- Portfolio managers are always looking for strategies to maximize returns while controlling the downside risk of their portfolios.
- ETFs are great for gaining exposure to various markets and sectors while maintaining diversification and reducing specific risks.
- We designed a simple yet effective Tactical Sector Rotation Strategy using nine ETFs that anyone can implement.
Introduction
Portfolio managers are always looking for strategies to maximize returns while controlling the downside risk of their portfolios. ETFs are great for gaining exposure to various markets and sectors while maintaining diversification and reducing specific risks. We designed a simple yet effective Tactical Sector Rotation Strategy using nine ETFs that anyone can implement.
This rule-based strategy invests in ETFs of different sectors, depending on phases of the business cycle. The investment approach implies shifting from certain sectors to others after reaching specific quantitative criteria on a macroeconomic indicator. It was backtested for over 30 years and recorded more than 17% annualized return (gross of fees) for that period.
This article is a follow-up to our very popular article: “This Sector Rotation Strategy Made 17% Each Year Since 1991“. We will cover the strategy’s performance since we revealed it. We will also revisit some aspects of the leading economic indicator behind the strategy to answer previous questions and amend a theoretical chart posted in the original article.
Performance
In October 2020, our strategy shifted to a new phase of the business cycle: the early phase, defined by growing economic output and corporate earnings. Based on empirical findings, we called that three sectors would outperform: energy, financials, and industrials. Let’s review each sector’s relative performance and also the performance of the strategy.
As the charts below illustrate, the out-of-sample performance supports our call. The chosen sectors have all outperformed the S&P 500 (SPY). From November 2020 to April 2021, both energy (XLE) and financials (XLF) have shown impressive performance, nearly 75.9%, and 53.6%, respectively while the S&P 500 did 28.9%. Those two sectors led the US equity market in the last two months of 2020 and the first quarter of 2021.
- Cyclical sectors: financials (XLF), materials (XLB), and discretionary (XLY).

Among cyclicals, financials outperformed significantly. Last year, financials showed the cheapest valuations despite major monetary/fiscal stimulus packages approved by several governments to soften the economic slowdown. The vaccine rollout, the reopening of economies, and the surge of 10-year bond yields also led to increased growth expectations. We discussed financials further in another article: “Financials Are Back In Style“.
- Defensive sectors: utilities (XLU), health care (XLV), and staples (XLP).

Defensive sectors underperformed during the first quarter of 2021. These sectors did not attract many investors as they focused on sectors benefiting from the global economic recovery. The main headwinds for these three sectors remain fear of high inflation rates and increasing bond yields.
- Sensitive sectors: energy (XLE), info tech (XLK), and industrials (XLI).
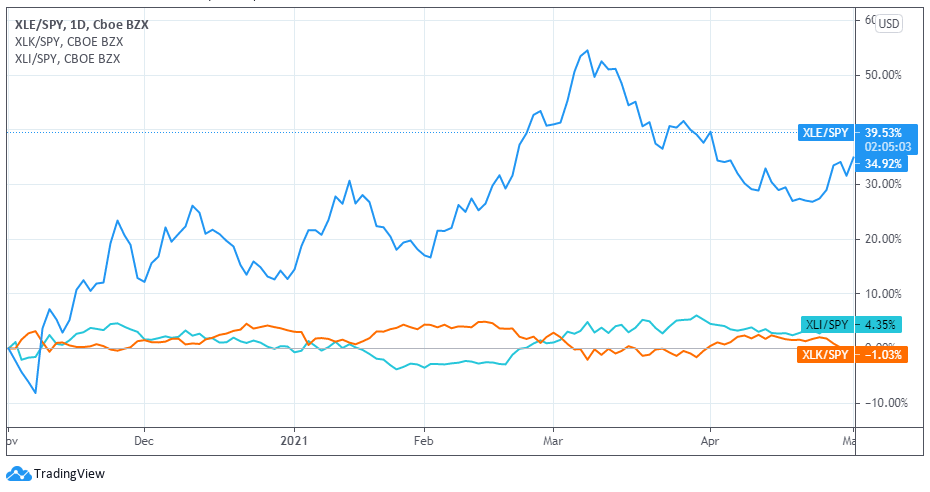
As the confidence in a recovery increased, the energy sector rebounded from its massive selloff and was the top performer sector in the first quarter. Crude oil rose significantly as business activity resumption created pent-up demand. As for the tech sector, it was the biggest outperformer in 2020. However, it lagged in the first quarter with the rate-driven sell-off.
The first quarter of 2021 was good for all sectors. Even the worst-performing ones remained in positive territory. The three sectors recommended by our Tactical Sector Rotation Strategy were on top of the list. As such, this year is continuing the early phase, which started last November.
| Sector Returns (%) | Apr 21 | Q1 2021 | Nov 20 – Apr 21 |
| Energy | 0.6 | 30.9 | 75.9 |
| Financials | 6.6 | 16.0 | 53.6 |
| Industrials | 3.6 | 11.4 | 35.5 |
| Materials | 5.3 | 9.1 | 32.6 |
| S&P 500 TR | 5.3 | 6.2 | 28.9 |
| Discretionary | 7.1 | 3.1 | 22.9 |
| Health Care | 4.0 | 3.2 | 20.3 |
| Utilities | 4.3 | 2.8 | 8.7 |
| Technology | 5.3 | 2.0 | 26.5 |
| Staples | 2.2 | 1.2 | 13.1 |
Source: Factor-Based
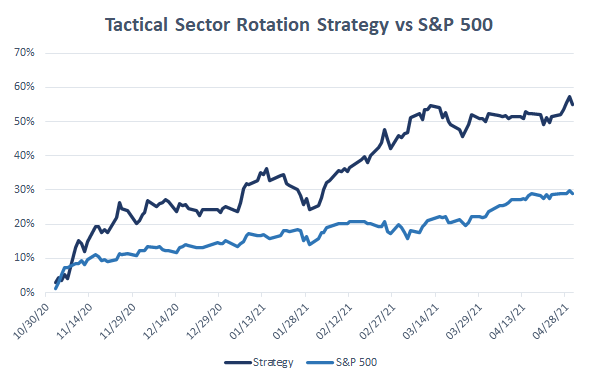
Since last November, when the phase switch occurred, the return of the Tactical Sector Rotation Strategy is a massive 55.0% compared to 28.9% for the S&P 500. The portfolio is outperforming since the start of this early phase, and the relative performance has been widening recently.
 Source: Factor-Based
Calendar Returns
As of April 30th, 2021
| Year | Strategy | S&P 500 | Difference |
| 1991 | 29.4 | 30.5 | -1.1 |
| 1992 | 11.8 | 7.6 | 4.2 |
| 1993 | 14.3 | 10.1 | 4.2 |
| 1994 | 4.1 | 1.3 | 2.7 |
| 1995 | 41.9 | 37.6 | 4.4 |
| 1996 | 32.4 | 23.0 | 9.4 |
| 1997 | 33.2 | 33.4 | -0.1 |
| 1998 | 53.1 | 28.6 | 24.5 |
| 1999 | 27.5 | 21.0 | 6.4 |
| 2000 | 0.6 | -9.1 | 9.7 |
| 2001 | -14.6 | -11.9 | -2.7 |
| 2002 | -15.1 | -22.1 | 7.0 |
| 2003 | 30.1 | 28.7 | 1.4 |
| 2004 | 20.2 | 10.9 | 9.3 |
| 2005 | 13.7 | 4.9 | 8.8 |
| 2006 | 14.9 | 15.8 | -0.8 |
| 2007 | 14.0 | 5.5 | 8.5 |
| 2008 | -15.4 | -37.0 | 21.6 |
| 2009 | 16.8 | 26.5 | -9.7 |
| 2010 | 19.8 | 15.1 | 4.8 |
| 2011 | 12.7 | 2.1 | 10.6 |
| 2012 | 16.6 | 16.0 | 0.6 |
| 2013 | 35.0 | 32.4 | 2.6 |
| 2014 | 22.8 | 13.7 | 9.1 |
| 2015 | 6.6 | 1.4 | 5.2 |
| 2016 | 15.7 | 12.0 | 3.7 |
| 2017 | 24.9 | 21.8 | 3.1 |
| 2018 | 2.5 | -4.4 | 6.9 |
| 2019 | 40.0 | 31.5 | 8.6 |
| 2020 | 38.3 | 18.4 | 19.9 |
| 2021 | 23.7 | 11.8 | 11.9 |
Source: Factor-Based
Performance Statistics
| Since Inception | Strategy | S&P 500 TR |
| Ann. Return (%) | 17.3 | 10.6 |
| Standard Dev. (%) | 15.0 | 14.5 |
| Max Drawdown (%) | -45.5 | -50.9 |
| Sharpe Ratio | 1.00 | 0.62 |
| Sortino Ratio | 1.42 | 0.82 |
| Index Correlation | 0.83 | 1.00 |
| Upside Capture | 1.05 | 0.00 |
| Downside Capture | 0.69 | 0.00 |
| Portfolio Beta | 0.86 | 1.00 |
| Portfolio Alpha (%) | 6.72 | 0.00 |
Source: Factor-Based
Leading Economic Indicator
Although each business cycle is unique and the performance among sectors varies, sector patterns tend to repeat themselves. Over the medium term, business cycles define equity performance. Therefore, outperforming the market can be achieved during all business cycles, assuming investors can incorporate a business cycle signal into a sector rotation framework.
As explained in our previous article, we use the Leading Economic Indicator (LEI) time series from the Conference Board to proxy the business cycle. We determined that the LEI year-over-year fluctuate between a top of 7% and a bottom of -3%. Over the last 60 years, there is no single instance where the LEI year-over-year failed to touch any of those two boundaries.
When studying the LEI, we split the business cycle into five different phases, as shown on the amended theoretical chart below. Our approach seeks to identify the illustrated turning points (black dots) as the LEI tends to change before the overall economy. We then match each phase with the sectors that are most likely to outperform in that segment of the business cycle.

Let’s take a look at the leading economic indicator itself. The LEI year-over-year in September was -3.8%. Our strategy assumed that the economy was in the recovery phase. In October, the LEI year-over-year recorded -2.8%, which crossed the -3% lower bound and started increasing, triggering the start of the early phase. In that phase, we identified with past business cycles that financials, energy, and industrials tend to outperform. Below is a detailed depiction of how the strategy switched phases since July 2019.
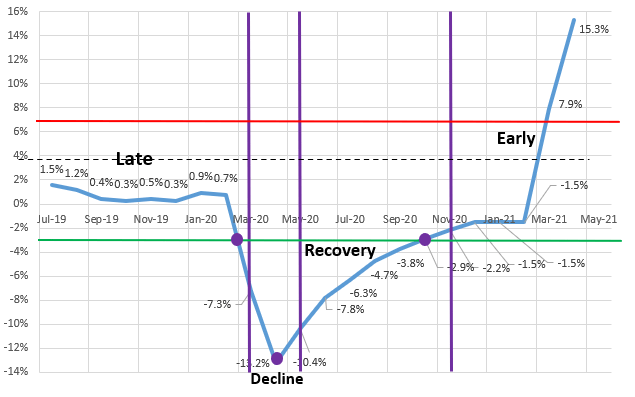
Simply put, we are using the upper and lower boundaries (7% or -3%) and the change of direction to call the sector rotation. You will also notice the purple vertical bars in the above chart are lagging the actual turning points. We are using the signal from the previous month to invest. Otherwise, the strategy would be flawed with a look-ahead bias.
The LEI year-over-year has been in an upward trend since October 2020 and crossed the 7% upper limit in March 2021 (7.9%), then reached a new high in April (15.3%). Once the trend starts decreasing in the coming months, the economy will switch to the late phase. This phase is characterized by a slowdown of economic output and corporate earnings. When that time comes, we will call for another set of sectors to outperform for that phase.
Timing is Key
Data drives each investment decision behind our strategy. We believe that the use of a leading indicator to help define the business cycle is helpful in finding when to buy and sell sector ETFs. The key for a successful investment strategy is determining the appropriate time to invest and find the best-performing instruments for that period. Quantitative strategies don’t let emotions or opinions bias the decision-making process. The decision is left to the facts reached from our analysis and empirical evidence.
Benefits
While the performance of this strategy is compelling, we will cite some of the main benefits or incentives of using our Tactical Sector Rotating Strategy:
- Exposure and diversification: Investors are exposed to different companies in each sector, which removes the specific risk from the portfolio;
- Low portfolio turnover: Only a few changes are made per year. Therefore, investors benefit from low transaction costs and higher tax efficiency.
- Low concentration: The strategy invests in 2-3 sectors in each phase of the business cycle. Each of those sectors are constitued of many industries.
Risks
To have a clear understanding of this investment strategy, we present below the main challenges or risks of our Tactical Sector Totating Strategy.
- Strategy continuity and future performance consistency: A significant concern is whether those sectors will continue to provide systematic outperformance across future business cycles. We believe it will be the case as long as the macro environment remains with low inflation.
- External factors: There is uncertainty regarding the effects of unpredictable events. For example, an event similar to the current pandemic may disrupt a business cycle and breach the investment rules already set.
Conclusion
Our Tactical Sector Rotation Strategy seizes opportunities within the business cycle and can add value to your portfolio. Professional investors can benefit from it as an overlay to their existing investment process. Retail investors can use it as a stand-alone strategy in a discount brokerage account.
For those interested in learning more about our Tactical Sector Rotation, a full presentation is available on our website. In our next article, we will discuss more extensively when we expect the move from the early phase to the late phase and prepare you for the next sector rotation opportunity.