Summary
- 30-year strategy backtest using GICS Sectors’ Total Return Indices.
- Invests in the top one to three ETFs out of ten Select Sector SPDR ETFs.
- Relies on a macro business cycle concept validated as far as the 1960s.
- Considers the easing and tightening effects of the U.S. monetary policy.
With all those discussions on the great sector rotation to cyclicals, I thought it would be a good idea to update a sector rotation strategy I created eight years ago. To my surprise, the strategy is still producing excellent results. I will start by showcasing the performance statistics as an incentive for you to read. I will then explain the step-by-step thought process to build the strategy.

In a nutshell, some sectors perform better than others, depending on where we are on the business cycle. As Mark Twain once said, history doesn’t repeat itself, but it often rhymes. I observed slight variations between each business cycle due to their uniqueness while studying those cycles. However, it seems as if a common denominator prevails, as I will demonstrate below.
The Sector Rotation Strategy
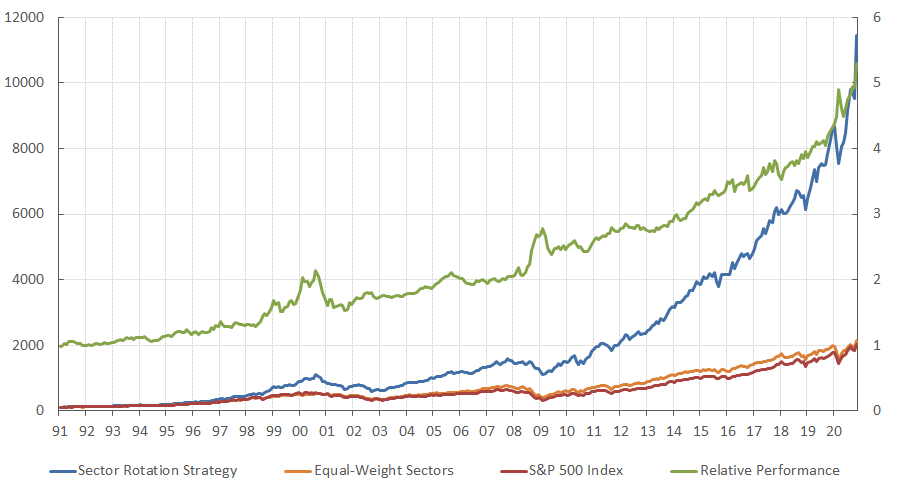
This strategy invests in the top one to three ETFs out of ten Select Sector SPDR ETFs and is rebalanced monthly. Transactions are recorded with the last closing price of the month. It is completely unlevered. It invests equally in each sector when there is more than one. The backtest of the strategy since 1991 is impressive compared to either the S&P 500 Total Return Index or a custom benchmark that invests equally in each of the ten sectors.
The ten Select Sector SPDR ETFs are:
| XLF: Financials | XLE: Energy | XLB: Materials | XLI: Industrials | XLY: Discretionary |
| XLP: Staples | XLU: Utilities | XLK: Info Tech | XLV: Health Care | XLC: Telecom |
The backtest uses the S&P GICS Sectors’ Total Return Indices instead of the ETFs because they didn’t exist in 1991. The inception of those ETFs was in 1998. It also makes sense to compare the sector rotation strategy gross of fees because I am benching against the S&P 500 Total Return Index. If you want to mimic the strategy in your portfolio, then I would recommend using the listed ETFs above. Please find below the performance statistics as of November 30th:
Calendar Returns
| Year | Strategy | S&P 500 | Difference |
| 1991 | 29.4 | 30.5 | -1.1 |
| 1992 | 11.8 | 7.6 | 4.2 |
| 1993 | 19.7 | 10.1 | 9.6 |
| 1994 | 4.1 | 1.3 | 2.7 |
| 1995 | 41.9 | 37.6 | 4.4 |
| 1996 | 32.4 | 23.0 | 9.4 |
| 1997 | 33.2 | 33.4 | -0.1 |
| 1998 | 53.1 | 28.6 | 24.5 |
| 1999 | 27.5 | 21.0 | 6.4 |
| 2000 | 0.6 | -9.1 | 9.7 |
| 2001 | -14.6 | -11.9 | -2.7 |
| 2002 | -15.1 | -22.1 | 7.0 |
| 2003 | 30.1 | 28.7 | 1.4 |
| 2004 | 20.2 | 10.9 | 9.3 |
| 2005 | 15.8 | 4.9 | 10.8 |
| 2006 | 14.9 | 15.8 | -0.8 |
| 2007 | 14.0 | 5.5 | 8.5 |
| 2008 | -15.4 | -37.0 | 21.6 |
| 2009 | 16.8 | 26.5 | -9.7 |
| 2010 | 19.8 | 15.1 | 4.8 |
| 2011 | 12.0 | 2.1 | 9.9 |
| 2012 | 16.6 | 16.0 | 0.6 |
| 2013 | 35.0 | 32.4 | 2.6 |
| 2014 | 22.8 | 13.7 | 9.1 |
| 2015 | 6.6 | 1.4 | 5.2 |
| 2016 | 15.7 | 12.0 | 3.7 |
| 2017 | 24.9 | 21.8 | 3.1 |
| 2018 | 2.5 | -4.4 | 6.9 |
| 2019 | 40.0 | 31.5 | 8.6 |
| 2020 | 33.0 | 14.0 | 19.0 |
Annualized Returns
| Periods | YTD | 3Y | 5Y | 10Y |
| Strategy | 33.0 | 22.7 | 22.4 | 21.4 |
| S&P 500 | 14.0 | 13.2 | 14.0 | 14.2 |
| Difference | 19.0 | 9.6 | 8.4 | 7.2 |
Performance Statistics
| Since Inception | Strategy | S&P 500 |
| Ann. Return (%) | 17.2 | 10.6 |
| Standard Dev. (%) | 14.8 | 14.5 |
| Max Drawdown (%) | -45.5 | -50.9 |
| Portfolio Turnover | 86.6 | 4.4 |
| Sortino Ratio | 1.38 | 0.79 |
| Index Correlation | 0.84 | 1.00 |
| Upside Capture | 1.04 | 0.00 |
| Downside Capture | 0.68 | 0.00 |
| Portfolio Beta | 0.85 | 1.00 |
| Portfolio Alpha (%) | 6.57 | 0.00 |
Each time the strategy suggests a change to a new phase in the business cycle, it churns completely. This means that all the ETFs held are immediately replaced by the newly recommended ETFs. Historically, there are some years where the sector allocation didn’t change, making it very easy to manage. I didn’t add transaction fees, but it doesn’t matter much with this low portfolio turnover. Finally, there is no liquidity issue with any of these ETFs.
Strategy Construction
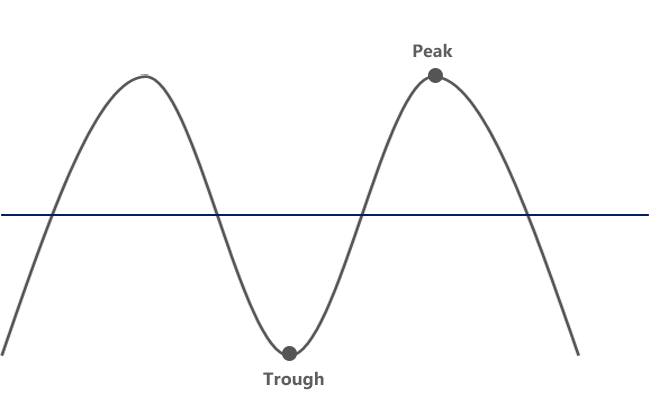
Business cycles are usually defined as a sequence of economic expansion and contraction, as shown below. I will use the Leading Economic Indicator (LEI) designed by the Conference Board as a proxy for the business cycle time series. It is usually published in the third week of each month at 10:00 am ET. It historically tends to lead the U.S. GDP by at least three months.
I chose the LEI over other economic time series for many reasons. First, it has historical data starting in 1954, which accounts for many business cycles. Second, it is a low standard deviation indicator, which is ideal for modeling purposes. Third, it is leading, and not coincident or lagging economic indicator. Since the end goal is to pick sectors, I want to minimize the signal lag.
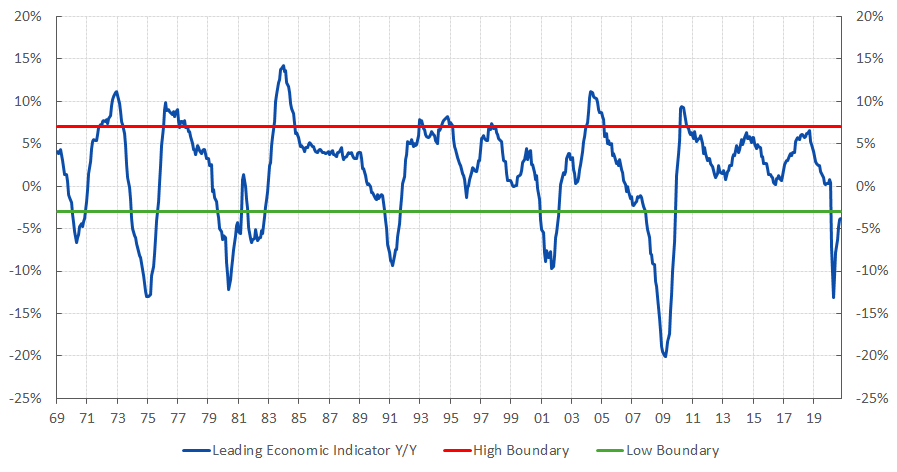
Before getting into details, let’s go back to the drawing board. I estimate that an extreme has occurred when the LEI turns around after reaching a certain threshold. I have looked at all the historical data available for the LEI and determined the top (red) at 7% and bottom (green) at -3%. In the last 60 years, the LEI always touched those bounds, so they aren’t overfitted.
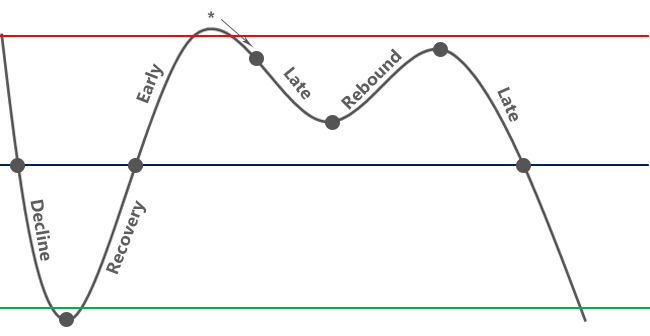
Now that I have established a framework with the LEI, the next step is to cut the business cycle into four phases: decline, recovery, early, and late. You will find below a description for each phase along with the sector outperformers. Please note I have classified those according to the textbook theory. Let’s find out if I can confirm these hypotheses as I assemble the strategy.
Decline Phase
- Economic output and corporate earnings are negative;
- Outperformers: Staples.
Recovery Phase
- Economic output and corporate earnings are recovering;
- Outperformers: Materials and discretionary.
Early Phase
- Economic output and corporate earnings are growing;
- Outperformers: Energy, financials and industrials.
Late Phase
- Economic output and corporate earnings are slowing;
- Outperformers: Info tech and health care.
I omitted two sectors: telecom and real estate. Telecom was expanded to include companies that were classified in info tech and discretionary, so its definition changed over time. Real estate is a recent spin off from financials. For all these reasons, I decided to only use the nine other sectors.
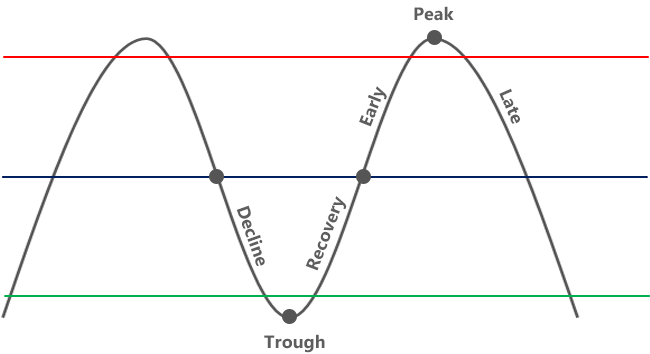
There are two issues with the theoretical concept. First, sectors outperforming in the early phase often outperform longer because the LEI reaches the peak too fast, as shown with the orange lines. This is not a problem with the decline and recovery phases because those are transient by nature. As a solution, I extended the early phase beyond the peak for a couple of months.
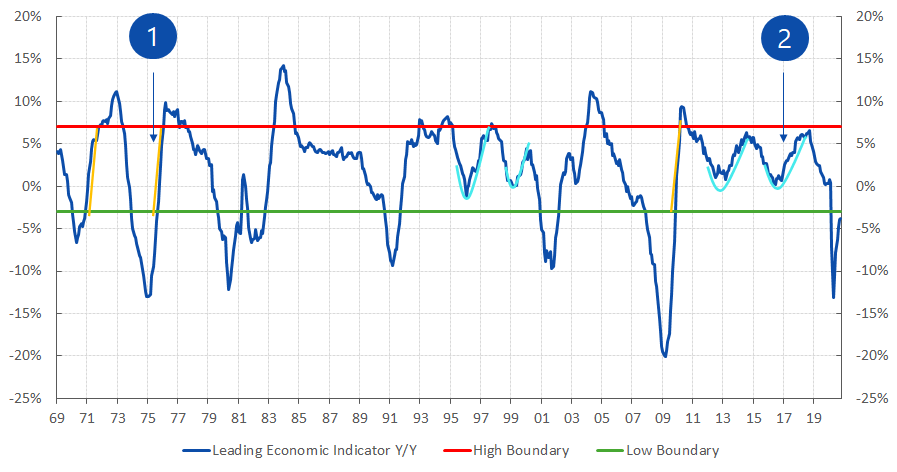
Second, the theoretical concept doesn’t take into account the impact of the monetary policy. Since the 90’s, Fed chairmans held an aggressive monetary policy creating economic rebounds, as shown with the teal lines. I call those the rebound phases. They appear after a slowdown is taking place, but before the activity turns negative. They may also happen more than once.
Rebound Phase
- Economic output and corporate earnings are bouncing;
- Outperformers: Info tech and utilities.
With a proprietary formula outside this article’s scope, I translate all the information previously discussed into a sequence time series ranging from 1 to 5 (each number represents a phase) that resets at each business cycle. Every time the phase changes, transactions occur in the strategy that reflect the sector rotation into the new recommended sector outperformers.
Here’s a suggestion for those who may be tempted to replicate the formula. You can model the LEI turnarounds to capture each rebound phase. You can also combine your LEI signal with those time series: Federal Reserve Total Assets (FARBAST Index) and Fed Fund Rate (FDTR Index). Whenever they signal a policy expansion or contraction, add them to the LEI signal.
Final Thoughts
As shown in the table below, the LEI rose above the threshold of -3% in late October. Therefore, the strategy switched to the early phase. In that phase, it is recommended to invest in energy, financials, and industrials. Unsurprisingly, those are the sectors that have outperformed the most in November.
| Date | LEI | High | Low | Phase |
| 06-2020 | -7.8% | 7% | -3% | 2 |
| 07-2020 | -6.3% | 7% | -3% | 2 |
| 08-2020 | -4.7% | 7% | -3% | 2 |
| 09-2020 | -3.9% | 7% | -3% | 2 |
| 10-2020 | -2.9% | 7% | -3% | 3 |
| 11-2020 | -3.0% | 7% | -3% | 3 |
COVID-19 vaccines or not, it seems like the U.S. economy was ready for this shift to cyclicals. How long is the early phase going to last? On average, it lasted between 10 to 22 months. My gut feeling is that it will be shorter than longer due to the V shape of this recovery and the massive easing in place.
This strategy is a good overlay to any investment process. I’m sure there’s still room for improvement, but this is my second iteration. If there’s enough interest, I will update when it changes to the late phase. Meanwhile, if you have any suggestions, please don’t hesitate to drop a comment below.
Finally, this framework with the LEI should keep working as long as the current low inflation environment, defined as inflation below 7.5%, remains the same. I think it’s safe to say interest rates are most likely to stay low, at least for the next two years, based on the most recent FOMC meeting statement.
Disclosure: I am/we are long XLF, XLE, XLI. I wrote this article myself, and it expresses my own opinions. I am not receiving compensation for it (other than from Seeking Alpha). I have no business relationship with any company whose stock is mentioned in this article.