Introduction
The sector rotation strategy is an investment approach that has gained popularity in recent years, which involves shifting investments between different sectors of the economy to take advantage of changes in the business cycles. Backed by over three decades of data, our strategy has proven to predict business cycle changes effectively. However, it could be a better strategy, and false signals can and do occur. In this article, we’ll examine a previous false signal in 2000-2001 and assess whether a similar situation is unfolding. We’ll take a close look at the macroeconomic indicators and try to determine whether the recent recovery signal is genuine or false.
The Fake Signal of 2000-2001
A notable example of a false recovery signal occurred during the Dotcom bubble of 2000-2001. During that period, the LEI Y/Y signaled a shift to the decline phase after dropping to -3.1% in December 2000 and continuing its downward trend until May 2001, when the signal shifted back to the recovery phase. This was seen as a potential recovery as the LEI Y/Y change slightly recovered from -8.9% to -7.8%. However, the recovery proved to be a false signal as the economy eventually entered a recession.
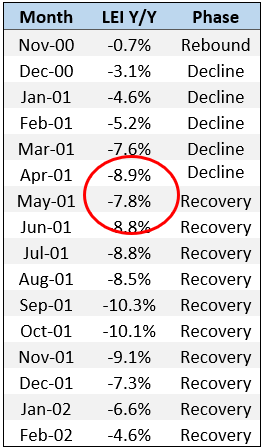
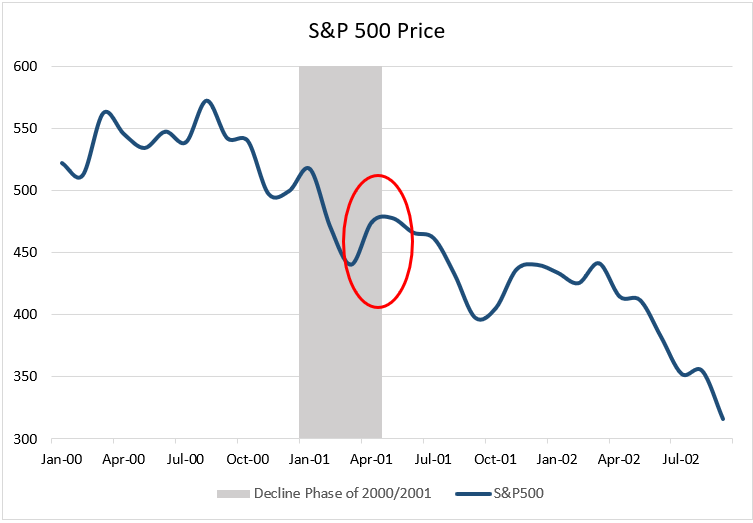
Before May 2001, the S&P 500 experienced a two-month rally. However, this rally did not last long as the market dropped again to even lower lows in June and remained at those low levels until mid-2002, indicating that the economy was still in the decline phase.
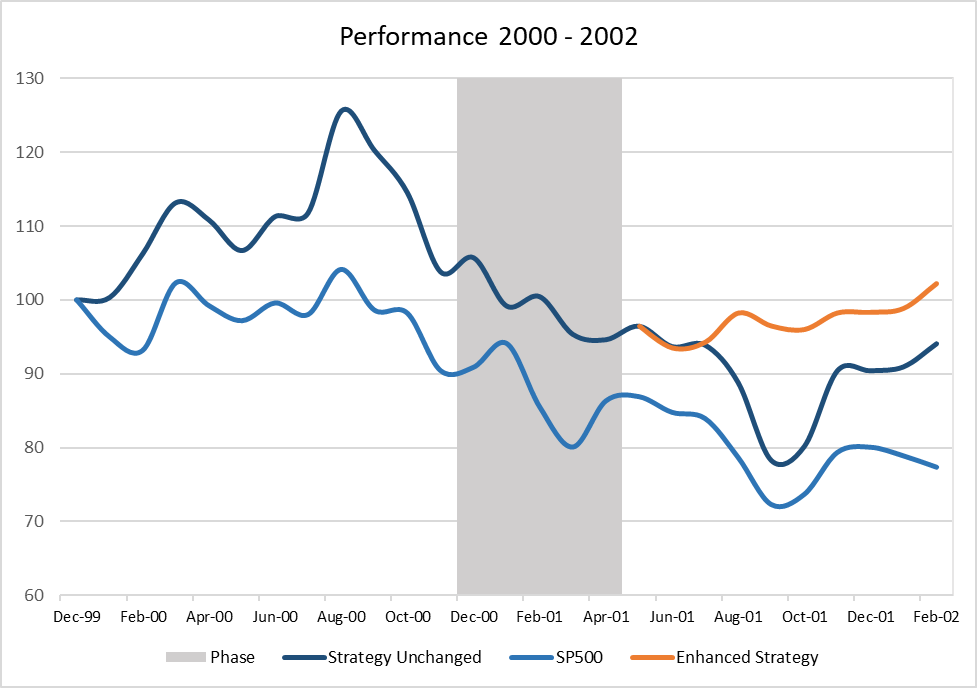
The strategy had indeed outperformed the market during that period, but it could have generated more positive returns if it had remained in the decline phase. Even if it took a month or two to identify the false recovery signal and adjust back to the decline phase, the strategy could still have delivered additional returns. However, accepting that the market has not fully recovered after a two-month rally is challenging, making it difficult to identify false signals and adjust the sector rotation strategy accordingly.
This raises the question of whether the signal indicating a recent shift to the recovery phase was false, highlighting the need to take precautionary steps to avoid unexpected market changes.
Similarities With 2000–2001
Similar LEI pattern
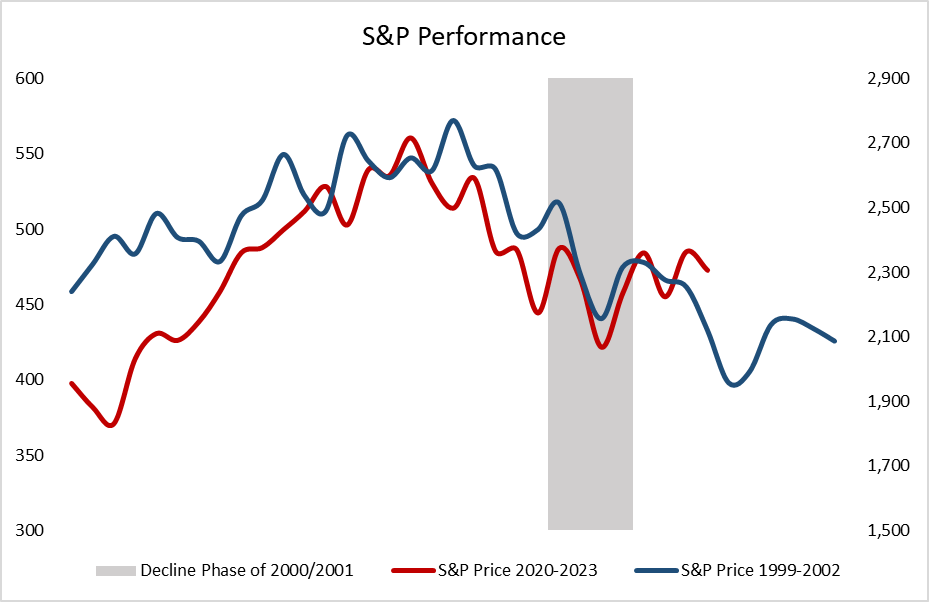
As mentioned earlier, there was a short-term rally of the S&P 500 for two months in 2021, followed by a recovery signal, just as we experienced during the first two months of 2023. However, earlier this month, the fundamentals and market performance were again on the brink of collapse due to the banking crisis that appears to be spreading.
Moreover, the LEI change Y/Y showed a slight monthly decrease (-5.9% in December 2022), while now it has continued its downward trend (-6.2% in January 2023 and -6.5% in February 2023).
Fed Rate Hikes
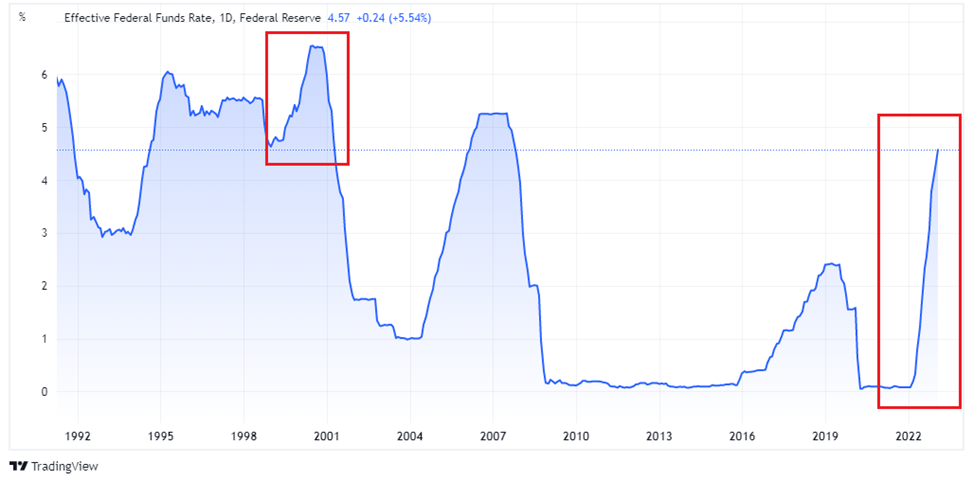
The tightening policies of the Federal Reserve in 2000 and 2022 have brought similar results in the stock market. In 2000, the Fed raised interest rates six times to curb financial-market exuberance and the growing equity bubble, which led to a bear market in stocks. Similarly, in 2022, the Fed hiked its policy rate by nearly 5% over the past year, compared with less than 2% of total rate hikes during 1999-2000, in response to inflation. However, this current tightening phase caught the markets more off guard than in 2000 because of unprecedented inflation pressures stemming from the reopening of the economy, global supply-chain disruptions, and exogenous shocks to commodity prices in 2022.
Yield Curve Inversion
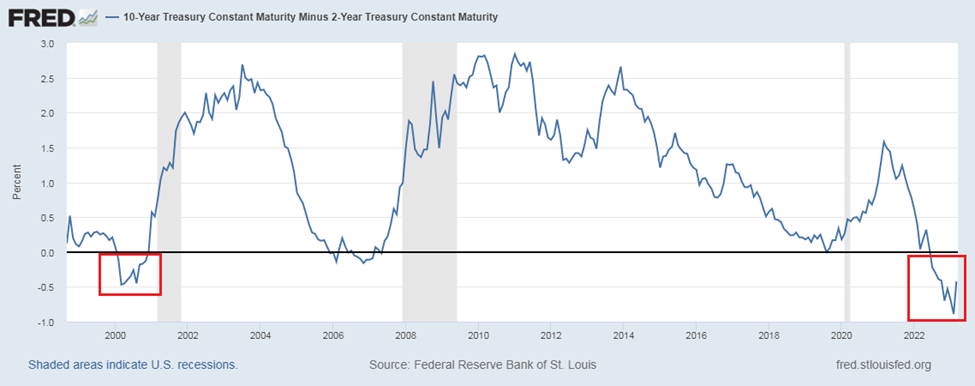
The yield curve notably inverted in early 2000 as the Fed raised rates while long-term rates began to decrease amid a worsening growth outlook. The yield curve is similarly inverted today, with 2-year yields hovering between 0.5% and 1.0% above the 10-year rate. This is a concerning indicator for the markets. An inverted yield curve is generally a starting point for a recession, especially since it is the highest inverted level since that period.
As mentioned earlier this month by Fed chairman Jerome Powell, the Fed still needs to be ready to pivot its policy and still has more work to do. In the upcoming FOMC meeting, the Fed is expected to raise rates by 0.25% or 0.50%, followed by smaller rate hikes in the upcoming months before entering an extended pause. It was anticipated that there would be a rate cut before the end of 2023, this is no longer the case, as analysts have started removing this scenario.
Following the last rate hike in 2000, the Fed began an easing cycle in January 2001 by cutting rates to help the sluggish economy. This time, however, the Fed is expected to maintain its policy rate longer before beginning any easing cycle. This means that the Fed will hold its policy rate above the 5% mark, which is extensively high, as it evaluates the path of inflation and the economy.
Economic Indicators
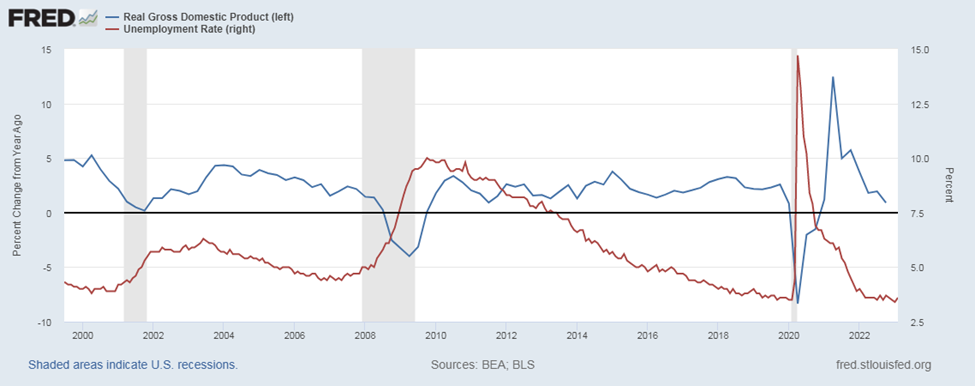
The current economic climate shares many similarities with the period of 2000-2001. In 2000, the economy was booming, with quarterly real GDP initially growing above 5% but decreasing to around 0.99% by the start of the recession in Q2-2001. Similarly, the economy has been exhibiting strength recently, particularly after the COVID-19 pandemic, with real GDP growing above 5% and then dropping to 0.90% in Q4-2022. Additionally, the economic downturn in 2001 showed a resilient labor market, with the unemployment rate only slightly increased from its low of 3.8% in April 2000 to 5.7% by the end of 2001. Similarly, today’s labor market is in excellent shape, with unemployment at 3.4%, and is expected to increase following the high-interest rates expected to weigh on the cost of borrowing.
Accordingly, while unique post-pandemic factors influence the current economic climate of 2022-2023, it also bears significant similarities to the period of 2000-2001. In both periods, the Fed raised interest rates, the yield curve inverted, and a resilient labor market provided stability. However, during the 2000-2001 period, a recession followed. These similarities suggest that the current economic climate may experience a mild recession similar to 2000-2001, with a moderate increase in unemployment.
Material to Outperform in Current Macro Environment
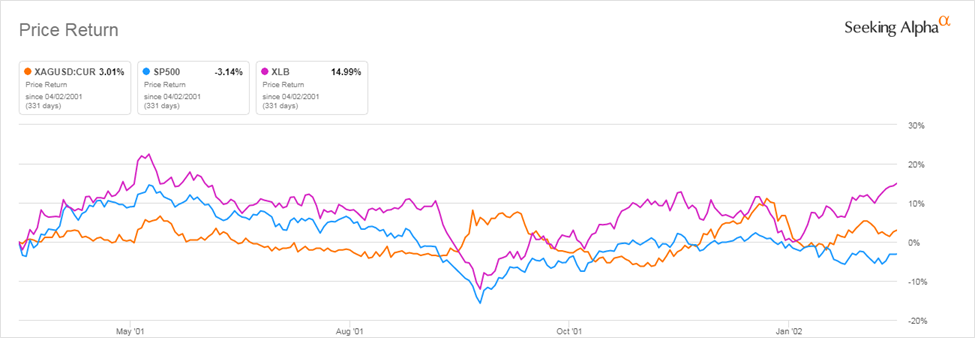
During the 2000-2001 bear market, the materials sector outperformed both the broader market and gold, making it one of the top-performing sectors. The materials sector is expected to continue to perform well thanks to various factors.
One of the most important factors is the reopening of China’s economy. As a major consumer of raw materials and industrial metals, China’s increased demand for these materials will likely significantly boost the materials sector. Additionally, the recent surge in commodity prices, including the costs of gold and silver, is expected to increase the profitability of companies in the materials sector, further driving investor interest in this sector.
Structural Differences Between 2000/2001 and Today
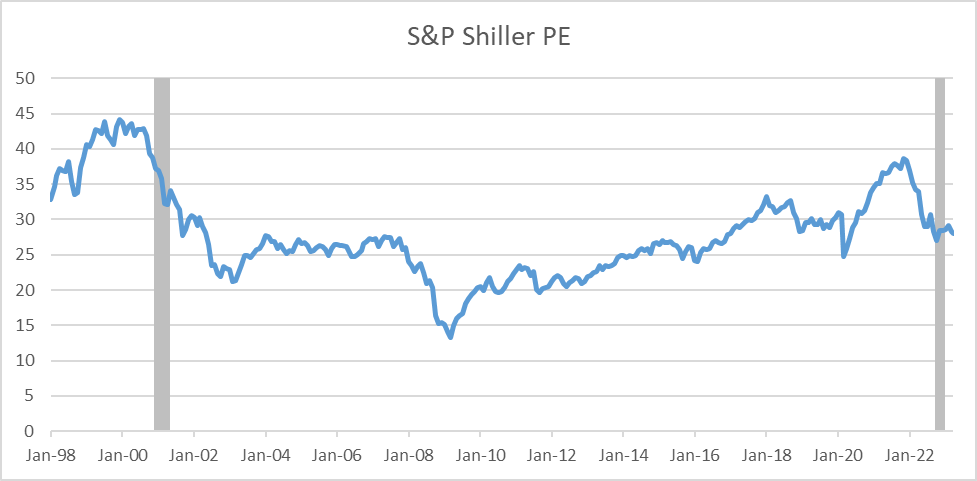
The current bear market fundamentally differs from the one experienced in 2000-2001. Unlike the tech bubble that drove the bear market in 2000-2001, this phase has been driven more by traditional cyclical monetary-policy forces and the Fed’s significantly aggressive monetary policy. Additionally, the relative valuations of stocks have been substantially less inflated this time. The S&P500 traded below 40 by the end of 2021, compared to valuations near 45 in 1999, and for tech-related stocks, far higher than that level. This suggests that investors have yet to be willing to pay as high a price for stocks during the current period as they were during the previous one.
Conclusion
In conclusion, it’s essential to be aware that a false signal in the sector rotation strategy can occur when the market appears to be transitioning to a new phase. Based on our analysis, the sector rotation strategy may have given a false signal indicating a shift to the recovery phase when the economy may still be in a decline phase. While there are similarities between the current economic conditions and the false signal in 2000/2001, caution is warranted given the differences in what led to this decline phase, which was driven more by traditional cyclical monetary-policy forces.
Despite these uncertainties, it is important to remain cautious during this period and monitor financial developments. The current sector mix is less affected by what is happening in the financial markets, as the financial sector has been hit the hardest. However, we cannot definitively say that it is a false signal, and it is too soon to make significant shifts in our strategy.
It is appropriate to stay the course of our current strategy and wait for more clarity on the financial stability of the market before making any significant changes. We should consider taking a different approach if there are indications of a contagion effect. For now, remaining vigilant and prepared is the best course of action.