Earlier this week, Pfizer released data from its Phase 2/3 trial. Clinical data shows the vaccine has an effectiveness of 90% seven days after the second dose. It didn’t take long for investors to dump pandemic-proof darlings and chase discounted discretionary and energy stocks. As a result of this rotation, our Canadian Equity Strategy is lagging the S&P/TSX TR by about 6% YTD. In this interim piece, we explain how and why we ended up underperforming. We will also discuss and express our point of view.
Implementation Discretion
As some clients may know, we always run two model versions for each of our strategies: 1) the automated model and 2) the guided model. The automated model is purely driven by the quant rankings and rules with no human intervention. The guided model uses the same quant rankings and rules but with a subjective overlay at the stock selection process. We attempt to find shining gems, dodge value traps, and reduce external risks within the best-ranked stocks. Let’s compare the YTD returns of both models:
Automated Model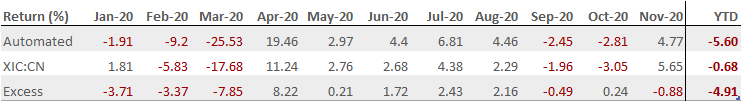
Guided Model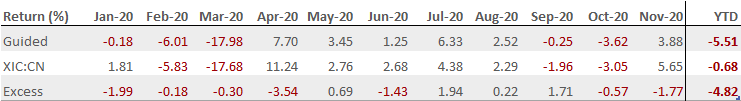
As shown above, the automated model held vulnerable cyclicals going into the bear market of March. It suffered a significant decline in the first quarter and partially recovered in the following months. In contrast, the guided model held more defensive stocks going through the same correction but lagged on the upside move of April and November. The overall impact of our subjective decisions is nearly zero. In other words, we did not create nor destroy any alpha by selecting the high-ranked stocks at each rebalancing date.
Assessing Our Ranking System
The next question we have to ask ourselves is the following: did our ranking system made of Quality, Value, and Momentum (QVM) factors correctly identify outperformers and underperformers during this COVID-19 pandemic? The best way to answer this question is to compare the backtest results of the last 20 years with those of the last 12 months. Let’s start to look at the 20-year backtest of our rankings shown below:
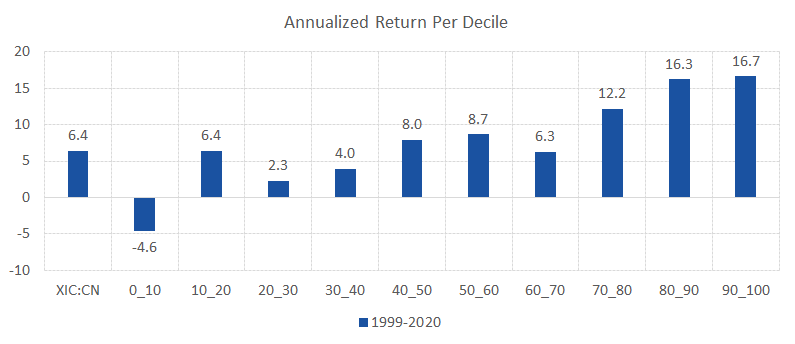
Stocks ranked between 70 and 100 historically outperformed all the stocks in the other deciles by a wide margin. This is why we buy stocks above 90 and sell those below 70. This relationship between deciles and annualized returns has been stable in the last 20 years, 10 years, and even 5 years timeframe. Now let’s compare those numbers with the backtest of our rankings shown for the last 12 months (teal):
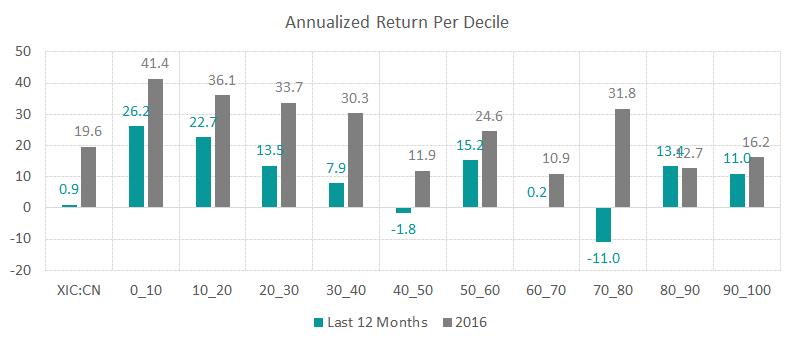
The first thing we notice is that the relationship between returns and deciles appears to have reversed. Stocks ranked between 0 and 40 are significantly outperforming this year. Stocks ranked between 80 and 100 are doing good as well but not as good. Surprisingly, stocks ranked between 70-80 are the worst performers. This is proof that our rankings and rules are not working as expected in 2020.
You may wonder if this is the only time we have seen this reverse relationship with our rankings? No, the same situation occurred in 2016 (grey) when we underperformed the S&P/TSX TR by 7.6%. We noticed the same pattern but with larger numbers when we compare the last 12 months with 2016. Stocks ranked between 0 and 40 have also done better than any other decile during that period.
What are these worst-ranked stocks? For the most part, they are a combination of low quality and/or negative value and/or weak momentum. It comes with no surprise that they are poised to bounce back at some point just like we saw in this latest rally. However, we think this move is more related to trading than investing. With a long-term horizon in mind, the highest-ranked stocks should outperform.
Yield Curve Comparison
A good analogy to explain this anomaly is to compare our rankings with the yield curve in fixed-income. Normally, the relationship between interest rates and maturity is upward sloping, just like our rankings. Rarely, the yield curve turns negative and the term structure flips over as investors fear a recession. Over the last 20 years, this has happened a few times, similar to the inversion observed in our rankings.
Does that mean we should act as contrarians to our rankings: 1) avoid the best-ranked stocks, 2) buy the worst-ranked stocks, and 3) sell them when their rank improves? We don’t think so. We have to keep in mind these are the only two years out of twenty, or 10% of the time, where our rankings have been less reliable. We have to admit that no ranking is perfect and that some periods will be challenging.
Conclusion
We share your concerns that the current environment is causing our rankings to have a reverse relationship. Based on past experience, this situation is most likely temporary. In the long run, we firmly believe investors should continue to reward high quality, low valuation, and good momentum companies. The return to normalcy with a vaccine will eventually create less external situations in which the ranking system will struggle with. The nomination of Biden as the new U.S. elected president should also help create more geopolitical stability around the world. We will keep monitoring this strategy closely going into 2021.